Ok folks… I have fixed the elusive high cpu usage bug when the control points are turned on. Now I just have to fix the similar issue when zooming in more than 100%. I’m assuming it’s going to be a similar issue causing the scene or graphic items to continually redraw unnecessarily.
Oh, wow! @Douglas… You’re a ![]()
I’ve narrowed down the zoom issue between the Jan 11 2023 and Apr 14 2023 builds. Could be related to the zoom to point feature that was added in that time frame. The control point issue was a legacy issue that existed since Val.
Curiosly the cpu use only goes up when zoomed more than 100.00%
Are you saying that zooming out is not a problem, but zooming in causes the CPU to run high? hmmm.
It’s more complicated than that… the cpu usage goes up when tools are within the view and you zoom greater than 100%. Zoom out below 100% and the cpu usage goes back down. Which is unlike the issue with the Control points that I fixed, where if the control points were turned on the cpu usage went up. Which had nothing to do with zooming, but rather a feedback loop between the control points and their curve causing endless repainting.
I’m stumped at the moment on the zooming cpu issue… especially since it seems the only tool that doesn’t cause the issue is the basepoint. I suspect it may a similar paint issue between the tool (point) and leader line / name where over 100% it’s causing a paint recursion. I’ll keep at it and figure it out.
Does it not, perhaps, have anything to do with what you were explaining here?
No… this issue makes the cpu usage go up and stay there. A large pattern will raise the cpu usage, but drop back down once it’s done parsing / calculating.
You can make just one line… and say you have basepoint A and point A1. If you zoom in more than 100% and point A1 is within the view… the CPU usage goes up - on my laptop to between 17-20%. If you zoom back under 100% the cpu drops to 0. If you zoom above 100%, and only point A only is showing the cpu is at 0… but if you scroll A1 into view it jumps back up.
The part that has me baffled at the momment is there no issue if only a basepoint is visible… it happens with any other tool. Actually I’m also baffled as to why 100.00% is the inflection point. BUT… those are 2 bits of info that will help me zero in to what’s causing it. Most likely is has to be a recursive event loop.
I may be way off base here, but… ![]()
The base point is the only point that doesn’t need to calculate lines or curves first in order to exist.
Correct. It’s more about which parent and inherited classes differ between the basepoint class and other tool point classes. I’ve identified the part that handles the 100% (or 1.0 scale) inflection point - and actually have fixed some of the issue… I got it down from 17-21% to like 2-7% on my machine. There’s probably still some mischievous
child acting up. ![]()
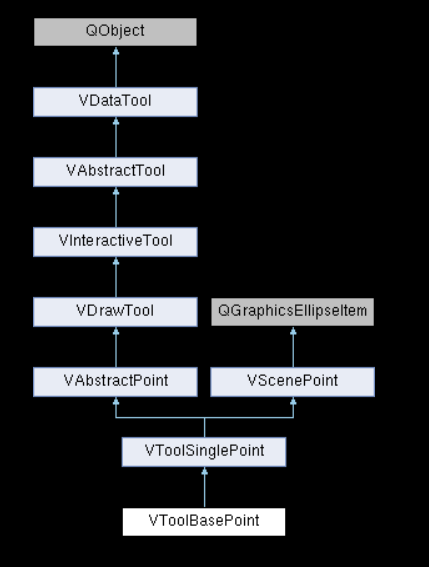
BTW… here’s the heirarchy of the vtoolbasepoint class which is similar to a couple other point classes like I was talking about this morning - as per Doxygen. ![]()

how do you toggle the control handles? i have one file that lags constantly.
Welcome to Seamly! @cutnup175 You can toggle the control point visibility by going to the View menu & selecting the Curve Control Points option, or by pressing v c
Happy drafting!
![]()
Thank you for the Welcome!! Oh! and for the the help. Unfortunately that did not fix my issue. It lags when im in Piece and draft mode when I drag and drop anything. (only this file others are ok) Im a newbee. I have only been drafting my own patterns for 3 years. Anyway, i have been playing with this AP for a little over a year (I think) in my off time. I found it when i was using Ubunto. Now I am using Windows 10 enterprise. Not sure what else you need. Yes my hips are that much different. Its why I make my own patterns. Haha!!! Pants08312024_834.sm2d (38.4 KB) TriciaInchesArmstrong.smis (3.8 KB)
Hello & welcome, @cutnup175
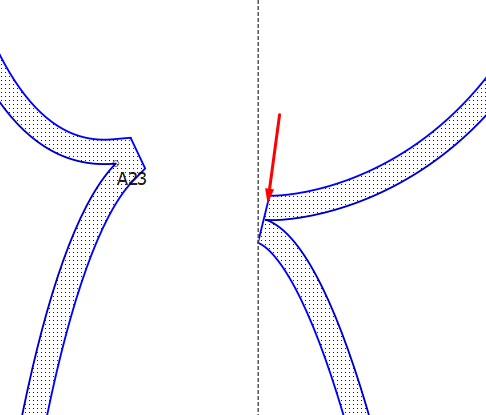
I’m looking at your pattern and I see that you don’t include the node between the curves. This could be the cause of the lagging. Normally, we need to place a node, then a curve and then a node again, before selecting a 2nd curve.

Please check if it’s working better for you & let us know. Perhaps this isn’t the problem, but it seems to be working better on my side now.
Pants08312024_834-Edited.sm2d (40.8 KB)
ty I had no idea. I had to do that. looks so much better too.
Yes, the app can be a bit persnickety when it comes to a pattern piece main path. I’m not sure exactly why a missing node between curves can cause the cpu to lag? Rt’s SA routines are still a bit of grey area for me. I can only guess that the cpu gets caught up in loops trying to do additional calculations in figuring out the seam allowances. I
You could try toggling the Seam Allowance off in Piece Mode and see if that improves the lagging. It would indicate to me that indeed there is a negative effect when there are issues in the main path - such as a missing node.

Is this issue fixed? I noticed that as I add more objects and calculation, the curve handling become more laggy. However, the CPU utilization in my Windows laptop does not go beyond 15%, and 5% on my desktop.
For a 2D CAD program, I expect every operation to be smooth. If this lag is due to my bad practice during drafting, I hope the program can brute force it way utilizing all the CPU power to make everything smooth.